OP Inspector
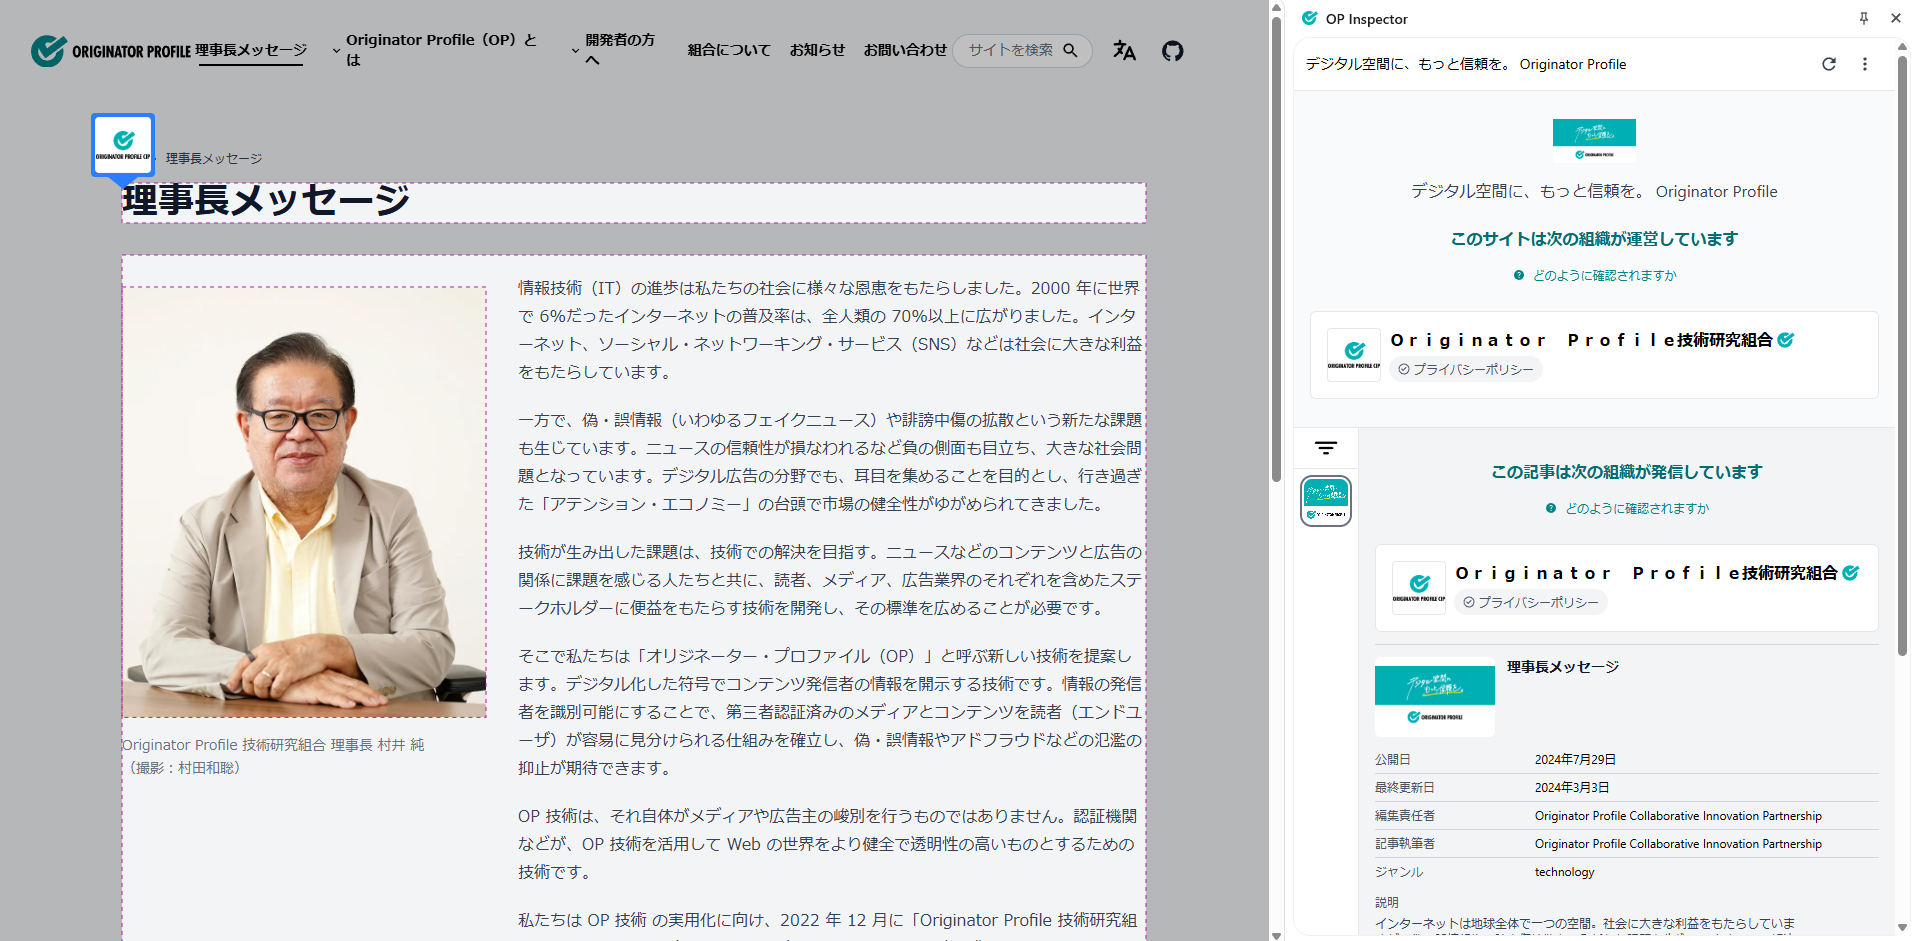
OP Inspector is a browser extension that allows you to view and verify Originator Profiles and Content Attestation within your web browser.
By accessing supported websites, you can check content originator information and its verification results.
Download
If you are using Google Chrome, you can get it from the "Chrome Web Store". If you are using Mozilla Firefox, you can get it from "Firefox Add-ons". See "Installing from the Chrome Web Store" or "Installing from Firefox Add-ons" for instructions.
If you want to try the development version, download the latest OP Inspector ZIP file from GitHub Releases.
| Browser | File name |
|---|---|
| Google Chrome | op_inspector-chromium-v*.zip |
| Mozilla Firefox | op_inspector-firefox-desktop-v*.zip |
Install
Google Chrome
Install from the Chrome Web Store (Recommended)
You can obtain OP Inspector from the official "Chrome Web Store".
- Go to the OP Inspector page on the Chrome Web Store.
- Click "Add to Chrome".
- Click "Add extension" in the confirmation dialog.
If you install from the Chrome Web Store, you do not need to manually replace the ZIP file.
Install in Developer Mode
If you want to try the latest development version, you can also manually install using the ZIP file downloaded from GitHub Releases.
- Extract the downloaded ZIP file.
- Enter
chrome://extensionsin your browser's address bar to open the extensions management screen.
- Alternatively, you can access it from the three-dot menu button in the upper right corner > "Extensions" > "Manage extensions".
- Enable "Developer mode" in the upper right corner of the screen.
- Click the "Load unpacked extension" button in the upper left corner of the screen.
- Select the directory where you extracted the ZIP file (the folder containing
manifest.json).
Reference: Loading unpacked extensions (Chrome for Developers)
Firefox
Install from Firefox Add-ons (Recommended)
You can obtain OP Inspector from the official "Firefox Add-ons".
- Go to the OP Inspector page on Firefox Add-ons.
- Click "Add to Firefox".
- Click "Add" in the confirmation dialog.
If you install from Firefox Add-ons, you do not need to manually replace the ZIP file.
Install as a Temporary Add-on
If you want to try the latest development version, you can also manually install using the ZIP file downloaded from GitHub Releases.
- Type
about:debuggingin the address bar. - Select "This Firefox" > "Load temporary add-ons...".
- Select the downloaded ZIP file.
Add-ons temporarily installed in Firefox will be disabled when Firefox is restarted.
Pinning to the Toolbar
It's convenient to pin OP Inspector to the toolbar for quick access.
Google Chrome
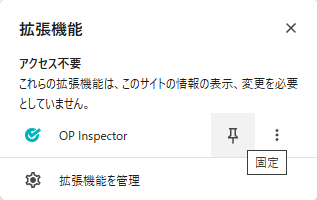
- Click the "Extensions" button (🧩 puzzle piece icon) in the upper right corner of your browser.
- Click the "Pin" button (📌 pin icon) next to the OP Inspector.
Reference: Pinning extensions (Chrome for Developers)
Firefox
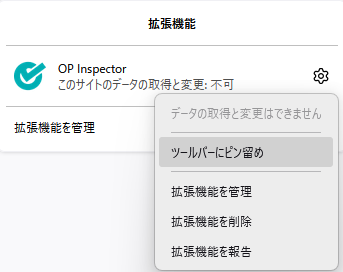
- Click the "Extensions" button (🧩 puzzle piece icon) in the upper right corner of your browser.
- Click the "Settings" button (⚙ gear icon) next to OP Inspector.
- Select "Pin to toolbar".
Verification method
Basic Usage
- With OP Inspector installed, access a website that supports Originator Profile.
- Click the OP Inspector icon in the toolbar.
- Content source information and verification results will be displayed in the side panel.
OP Inspector does not work on tabs that were already loaded before installation. Please open a new tab or reload the page after installing it.
In versions prior to v0.5, the OP Inspector appeared as a pop-up.
Badge Display

The OP Inspector icon displays a badge indicating the number of successfully verified Content Attestations.
- The number on the badge represents the total count of verified Content Attestations, including those for ads.
- The badge is not displayed if there are no Content Attestations or if even a single verification fails.
How to interpret verification results
If verification is successful, the sender's information (name, image, etc.) will be displayed.
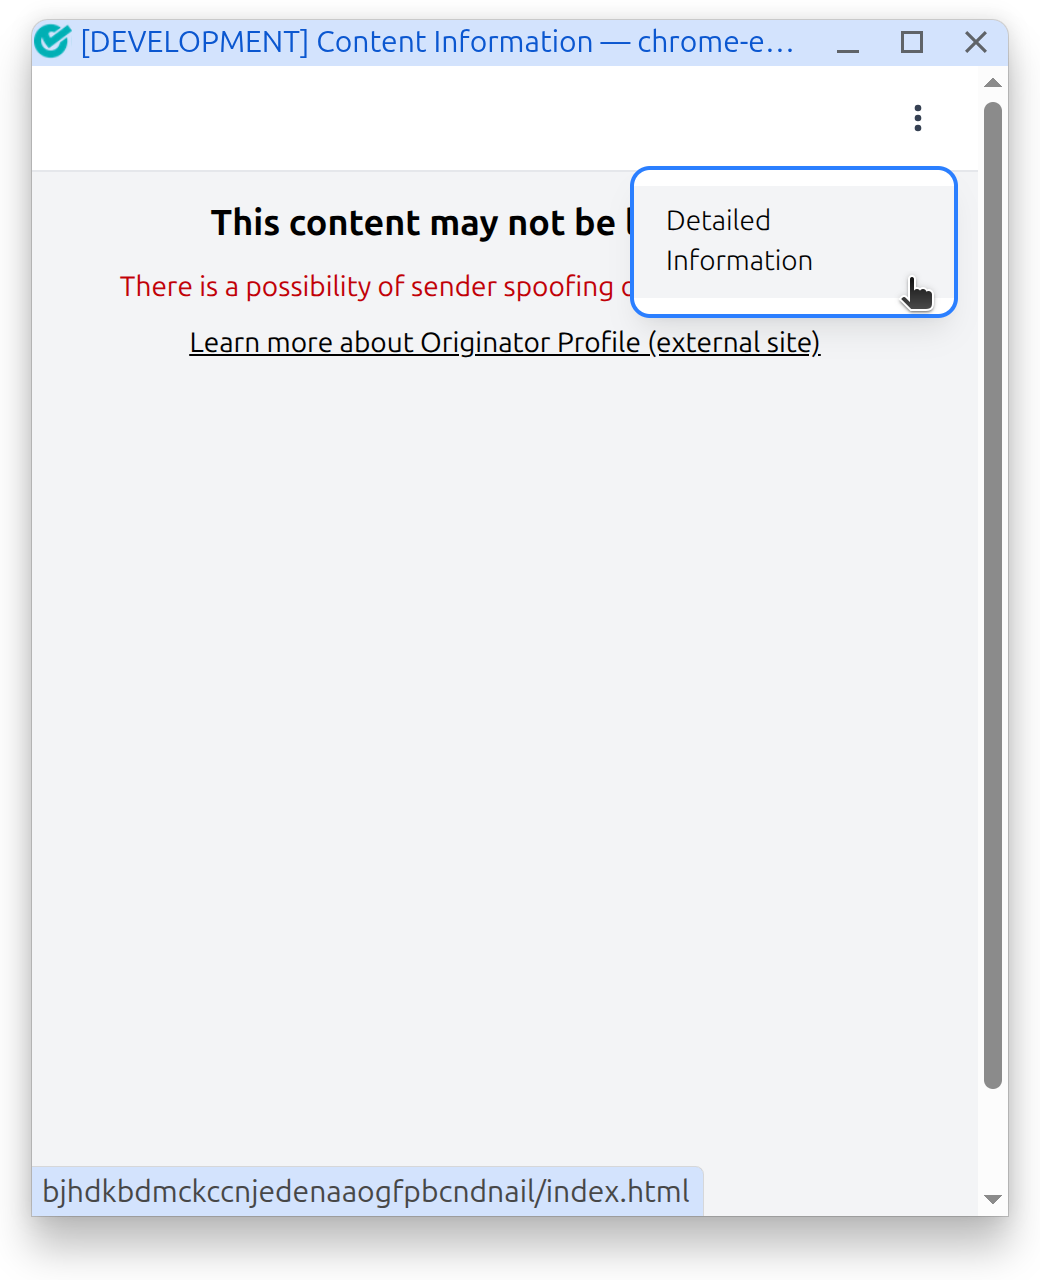
If verification fails, you can view detailed verification results by clicking the OP Inspector icon and selecting "More Information" from the kebab menu (︙ vertical three-dot icon).
On websites that do not support Originator Profile, the following screen will be displayed.
This screen may also be displayed due to other reasons, so please check the error message.
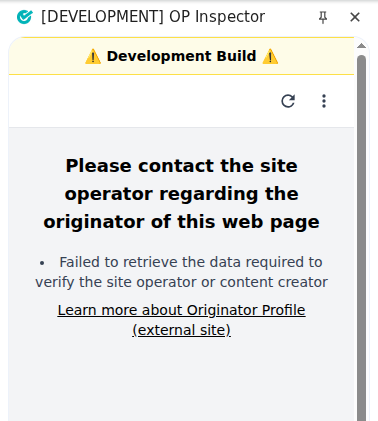
Even if this screen is displayed, you can view detailed verification results by selecting "More Information" from the kebab menu (︙ vertical three-dot icon).
The method of checking is the same as when verification fails.
Detailed information screen
Verification results
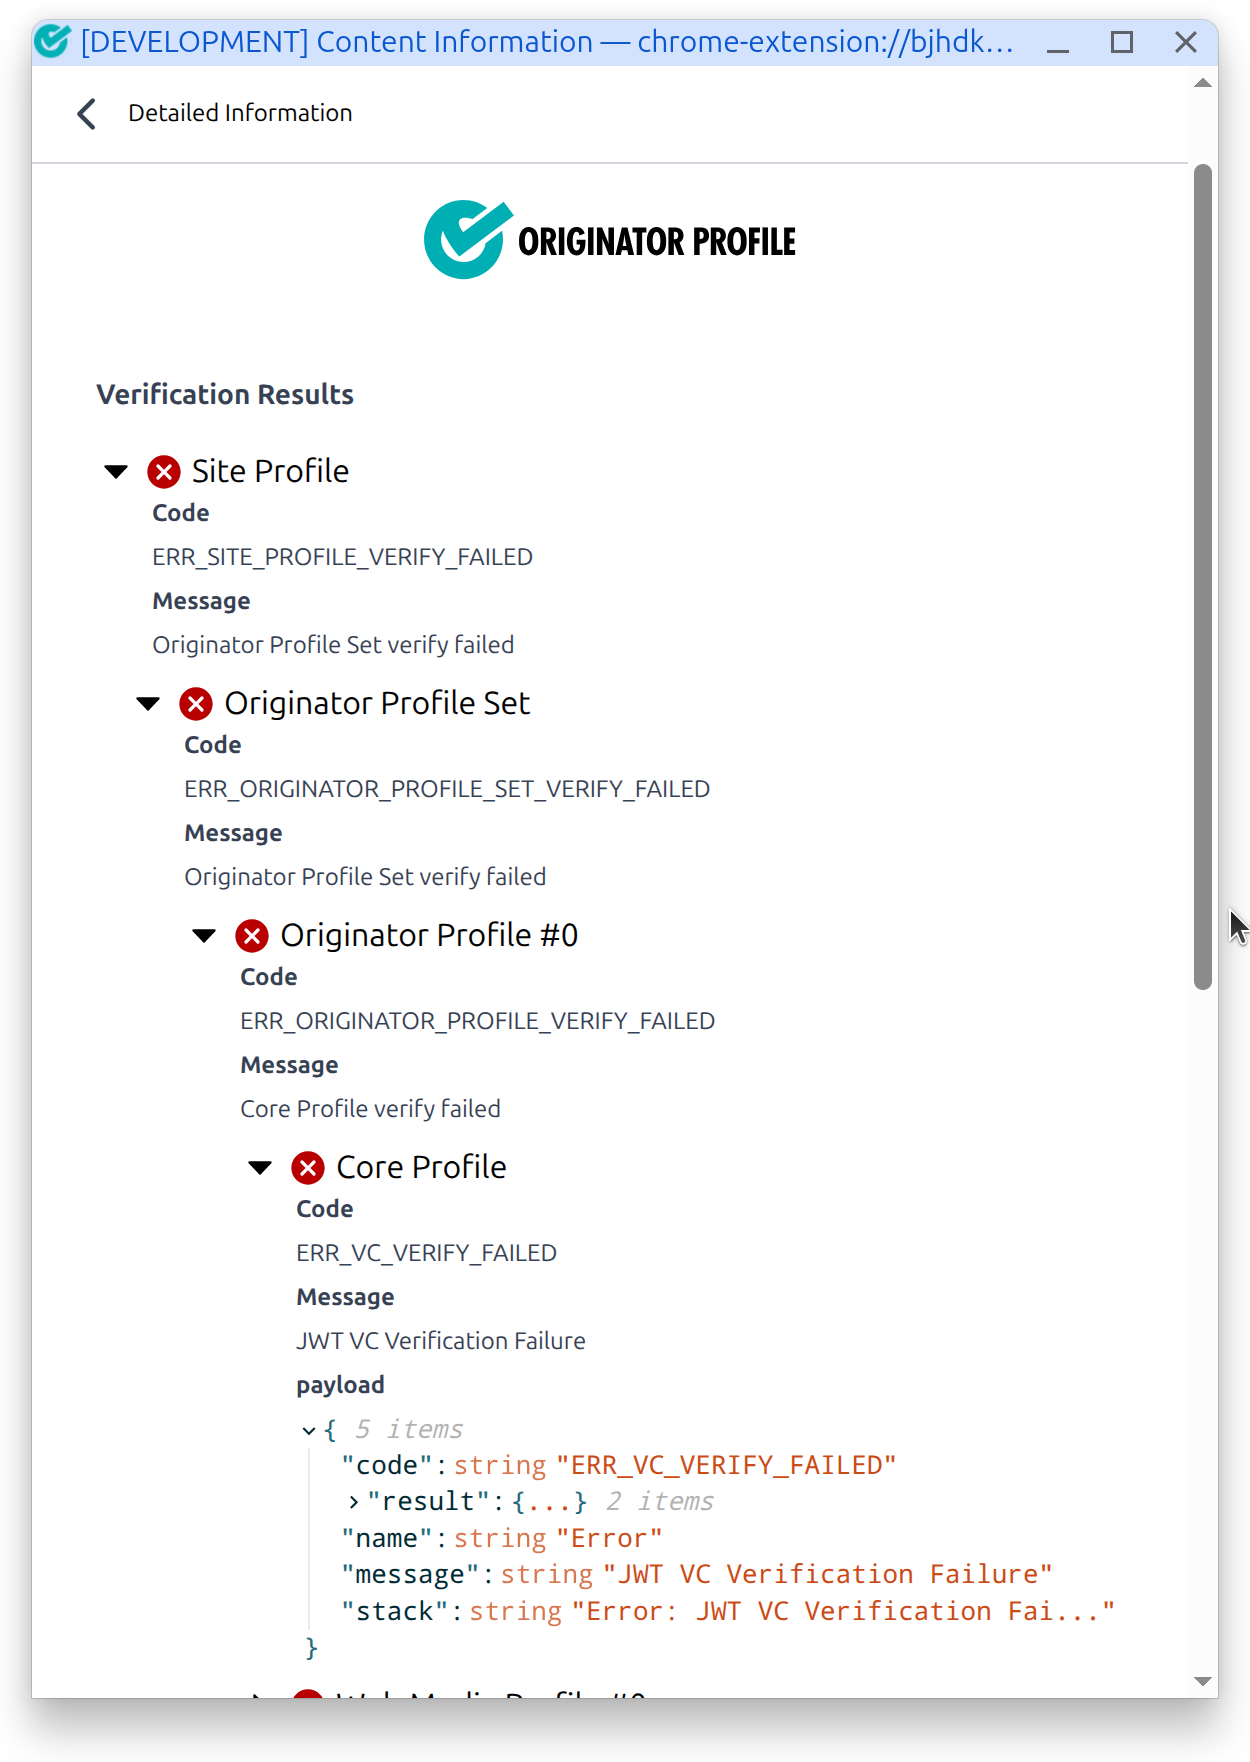
If a verification error occurs, you can expand the "Validation Results" tree to see the error code and message.
-
Click "▶" to expand the tree.
-
Code: The error code is displayed. See Error Reference for the meaning of the error code.
-
payload: The verification result data is displayed in JSON format.
The tree has a nested structure; expanding it will show more detailed error information.
Detailed Information
The "Detailed Information" tree displays the raw data used for verification.
- Site Profile: Originator information about the website
- Originator Profile Set: A collection of originator profiles
- Content Attestation Set: Content attestation data
Copying JSON Data
JSON data displayed in the tree can be copied by clicking the clipboard icon (📋) that appears when you mouse over a node.
- Clicking the root node's icon copies the entire JSON.
- Clicking a specific node's icon copies only the JSON under that node.
The copied data is useful for detailed verification by pasting it into Debugger or attaching it when reporting problems.
Updating OP Inspector
When a new version is released, you can update your OP Inspector by following these steps:
Google Chrome
If you installed from the Chrome Web Store, updates will be performed automatically. No manual intervention is required.
If you installed in Developer mode, follow these steps to update.
- Download the latest version from GitHub Releases and extract it.
- Replace the location of the previous ZIP file with the latest version.
- Open
chrome://extensionsand click the refresh icon (to the left of the on/off toggle button) for the OP Inspector.
Reference: Reload extensions (Chrome for Developers)
Firefox
If you installed from Firefox Add-ons, updates will be performed automatically. No manual intervention is required.
If you installed as a temporary add-on, follow these steps to update.
- Download the latest version from GitHub Releases.
- Go to
about:debugging. - Select "This Firefox" > "Load temporary add-on..." and specify the latest ZIP file.
After updating, if the target page is already open, please reload the page or open a new tab.
Displaying images
Image for Content Attestation
Images included in Content Attestation are displayed within a 120px wide x 80px high display area while maintaining their aspect ratio.
- Images smaller than the display area are centered at their original size.
- Images larger than the display area are scaled down while maintaining their aspect ratio.
- If no image is specified, a placeholder image is displayed.
In the left-hand icon area (44px wide x 44px high), images are resized to cover the entire display area while maintaining their aspect ratio, and any excess is cropped.
Website Profile Image
Website profile images are displayed within a 240px wide x 44px high display area, maintaining their aspect ratio.
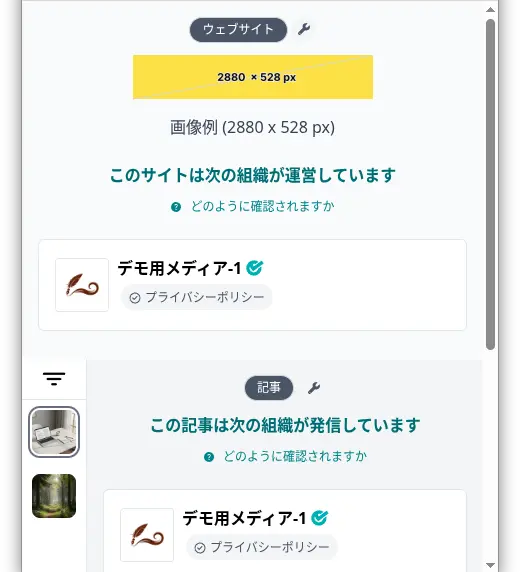
If the image does not display:
To display the image correctly, you need to allow external access to the image. For more information, see "Image not displaying".
Known Limitations
- OP Inspector will not work in tabs that were loaded before installation. Please open a new tab or reload the page after installation.
- Images must be displayed on the image server, which must allow CORS (
Access-Control-Allow-Origin: *). - In Firefox, temporarily installed add-ons will be disabled when the browser is restarted.
Related
- Debugger - Debugging tool for Originator Profile
- Content Attestation Server Playground - Content Attestation publishing and verification test environment
- Troubleshooting - How to deal with images not displaying
- Error Reference - Details of error codes